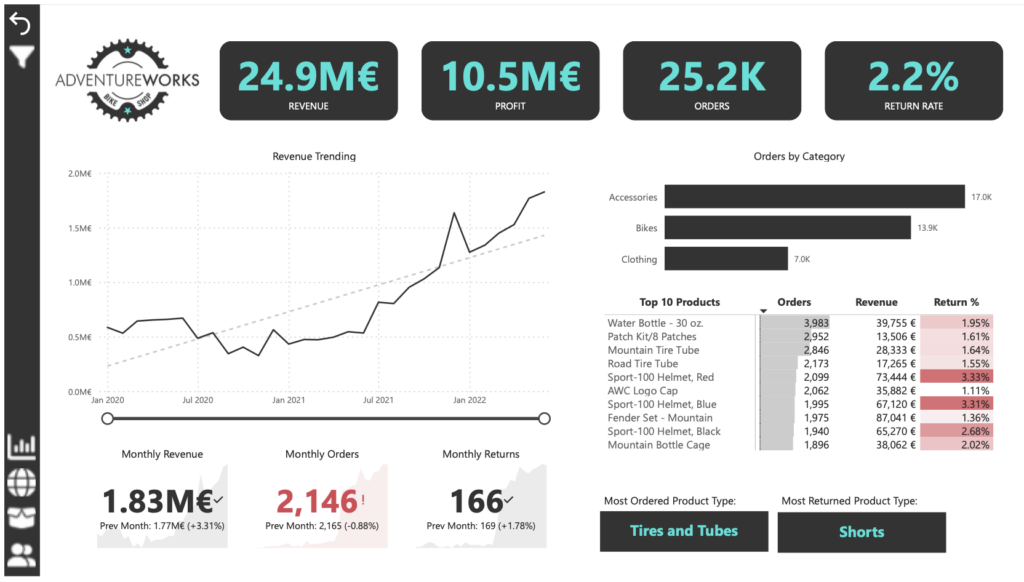
Hi, I’m Muhammad Umar
a
Data Scientist
ML Engineer
AI Specialist
BI Developer
As an aspiring Data Scientist with hands-on experience in Python, Machine Learning, and LLM-powered AI, I specialize in building, evaluating, and deploying predictive models and intelligent agents. I have practical experience in feature engineering, model evaluation, and designing agentic workflows with LangChain, and have successfully built and deployed 7+ projects, including prediction models, document analyzers, AI agents, and APIs on Hugging Face Spaces. My work combines data-driven problem solving, deployment expertise, and practical AI implementation, preparing me to deliver actionable insights and intelligent solutions. I am now seeking opportunities as a Data Scientist or ML Engineer, where I can leverage my technical skills, analytical thinking, and experience with agentic AI to solve complex business and research challenges.
What I Do
Data Analyst
As a Data Analyst, I collect and clean data from different sources using SQL and Python. I explore data to find trends, patterns, and errors, run simple statistics and tests, and build repeatable workflows. I make clear charts, dashboards, and reports so clients can understand results quickly. I give practical recommendations, automate routine reports, and help teams use data to make better decisions.
Data Scientist
As a Data Scientist, I build models to predict and explain business outcomes using Python tools like scikit-learn and TensorFlow. I clean and prepare data, create features, and test models with clear metrics. I analyze text and images when needed, run experiments, and improve models over time. I explain results in simple terms, make actionable recommendations, and help clients use models to forecast demand, find customer groups, and solve complex problems.
Machine Learning Engineer
As a Machine Learning Engineer, I turn models into working tools that run in real products. I build data pipelines, prepare data for fast use, and optimize models for speed and reliability. I deploy models like APIs or services, set up monitoring and alerts, and automate retraining when performance drops. I work with developers and IT to integrate models, write clear documentation, and make sure solutions are stable, secure, and useful for clients.
My Portfolio
The Situation:
Adventure Works is a fictional global manufacturing company that produces cycling equipment and accessories, with activities stretching across three continents (North America, Europe, and Oceania). Our goal is to transform their raw data into meaningful insights and recommendations for management. More specifically, we need to:
- Track KPIs (sales, revenue, profit, returns)
- Compare regional performance
- Analyse product-level trends
- Identify high-value customers
The Data:
We’ve been given a collection of raw data (CSV files), which contain information about transactions, returns, products, customers, and sales territories in a total of eight tables, spanning from the years 2020 to 2022.
The Task: We are tasked with using solely Microsoft Power BI to:
- Connect and transform/shape the data in Power BI’s back-end using Power Query
- Build a relational data model, linking the 8 fact and dimension tables
- Create calculated columns and measures with DAX
- Design a multi-page interactive dashboard to visualize the data in Power BI’s front-end
The Process:
1. Connecting and Shaping the Data
Firstly, we imported the data into the Power Query editor to transform and clean it. The next process involved:
Removing Duplicates: Duplicate entries were removed from the dataset to ensure accurate analysis.
Handling Null or Missing Values: For some columns, missing values were replaced with defaults or averages. Null values in “key” columns were removed using filters.
Data Type Conversion: Columns were converted to appropriate data types to ensure consistency. Dates were converted to Date type, numerical columns to Decimal or Whole Numbers, and text columns to Text.
Column Splitting and Merging: Several columns were split to separate concatenated information, or merged to create a unified name (such as Customer Full Name).
Standardising Date Formats: All date columns were formatted consistently to facilitate time-based analysis. This step was important for ensuring accurate time-series analysis in Power BI.
Removing Unnecessary Columns: Irrelevant columns were removed to streamline the dataset. This helped focus the analysis on relevant information, reducing memory usage and improving performance.
2. Building a Relational Data Model
Secondly, we modeled the data to create a snowflake schema. This process involved creating relationships between the dimension and fact tables, ensuring cardinalities were one-to-many relationships.
Enabling active or inactive relationships, creating hierarchies for fields such as Geography (Continent-Country-Region) and Date (Start of Year-Start of Month-Start of Week-Date), and finally hiding the foreign keys from report view to ease the data analysis and visualization steps and reduce errors.

3. Creating Calculated Columns and Measures
Next, we used Power BI’s front-end formula language, DAX, to analyze our relational data model and create several calculated columns (for filtering) and measures (for aggregation), that we could later reference and use when analyzing and visualizing the data.
We used calculated columns to determine whether a customer is a parent (Yes/No), a customer’s income level (Very High/High/Average/Low), a customer’s priority status (Priority/ Standard), and the customer’s educational level (High School/ Undergrad/ Graduate).
The list of calculated measures is available below and includes key information on revenue, profit, orders, returns, and more.

4. Visualising the Data
The final step of the project was creating a multi-page interactive dashboard, including a range of visuals and KPIs that could serve management and lead to informed decision-making. We used several visuals and tools to demonstrate and visualize the data across the 4 report pages, including KPI cards, line and bar charts, matrices, gauge charts, maps, donut charts, and slicers. We made sure the report was fully interactive and simple to navigate, with icons used to enable filters, cancel filters, and guide users to each report page with ease. Features such as drill-through, bookmarks, parameters, and tooltips were also used throughout the dashboard, further enhancing its usefulness and impact on management.
Executive Dashboard: The first report page provides a high-level view of Adventure Works’ overall performance. We used card visuals to present Key Performance Indicators such as overall revenue, profit margins, total orders, and return rates. We also included additional cards to compare current and previous month performances, providing insights into recent trends, a line chart to visualize the trending revenue from 2020-2022 and highlight long-term performance, and presented the number of orders by product category to aid in understanding product sales distribution, and used a further table to display the top 10 products based on key indicators (total orders, revenue, and return rate).

Map: The second report page consisted of a map visual, an interactive representation of sales volume across different geographical locations. This offered insight into Adventure Works’ global sales distribution and worldwide reach.

Product Detail: The third report page focuses on detailed product-level analysis. It displayed detailed product information for the selected top 10 products from the Executive Dashboard, using the drill-through feature. It also included gauge charts presenting actual performance vs target performance of monthly orders, revenue, and profit, and included an interactive line chart to visualize potential profit adjustments when manipulating the price of the product, aiding in strategic decision-making regarding pricing strategies. This report page also included a line chart including key weekly product information on total orders, revenue, profit, returns, and return rate.

Customer Detail: The fourth and final report page provided a deeper insight into customer behavior and value. It used donut charts to break down customer groups into income level and occupation categories vs. total orders, helping in customer segmentation tactics, and used a matrix aided by KPI cards to identify high-value customers based on order and revenue contributions, aiding in identifying high-value customers and sales opportunities.

My Resume
Experience Background
HR Co-ordinator
HTA (Oct 2024 - Present)
- Coordinate end-to-end recruitment processes, including job postings, scheduling interviews,
and communicating with candidates.
- Maintain accurate and up-to-date employee records, ensuring confidentiality and compliance.
- Handle employee queries regarding HR policies, benefits, and payroll.
- Assist in the onboarding process for new hires, including documentation, orientation, and
benefits enrollment.
- Support HR Manager in organizing training programs and performance evaluations.
- Prepare Monthly reports on HR metrics like turnover rates, absenteeism, and hiring trends
Education Background
Master's of Administrative Sciences (MAS)
University of Karachi (Feb 2022 - Jan 2023)
Post Graduate Diploma in Public Administration (PGDPA)
University of Karachi (Feb 2021 - Jan 2023)
Soft Skill
Leadership & Strategic Planning
Training and Development
Teamwork and Coordination
Recruiting & Onboarding
Communication & Presentation
Technical Skill
PYTHON
MICROSOFT EXCEL
POWER BI
STRUCTURED QUERY LANGUAGE (SQL)
MACHINE LEARNING
STATISTICS
DEEP LEARNING
Certifications
Professional Data Scientist Certification Program
Analytix Camp (May 2025 – Nov 2025)1. Python for Data Science and Analytics: I use Python with Pandas and NumPy to Collect, Clean, and Transform Data, perform Exploratory Data Analysis (EDA), and build reproducible analysis scripts and visual prototypes. 2. SQL for Data Extraction and Manipulation: I write efficient SQL queries to Extract, Join, and Aggregate data from relational Databases, supporting reliable Data Pipelines and Model Training. 3. Foundations of Artificial Intelligence: I understand core AI concepts, problem formulation, and ethical considerations, which help me choose the right methods and design responsible AI solutions. 4. Machine Learning: I build, Evaluate, and Tune Machine Learning models (Regression, Trees, Clustering), perform Feature Engineering, and use Cross-Validation to deliver accurate, actionable predictions. 5. Deep Learning: I design and train Deep Learning models for complex tasks, manage optimization and regularization, and apply these models to problems in vision, text, and tabular data. 6. Neural Networks (ANN / CNN / RNN): I implement ANN, CNN, and RNN architectures, adapt them to task needs, and interpret model behavior for real-world applications in image, sequence, and general prediction tasks. 7. LSTM (Long Short-Term Memory): I build and tune LSTM models for time series and sequential data, applying them to forecasting, anomaly detection, and sequence prediction problems. 8. Large Language Models (LLM): I work with LLMs to Perform Understanding and Generation tasks, fine-tune models for domain needs, and evaluate outputs for quality and safety. 9. Hugging Face Ecosystem: I use Hugging Face tools for Tokenization, Fine-Tuning, and Model Serving, preparing datasets and deploying transformer-based solutions efficiently. 10. LangChain and RAG (Retrieval-Augmented Generation): I build RAG systems and agent workflows with LangChain, connecting Vector Stores and Retrieval Pipelines to improve accuracy and provide up-to-date answers. 11. Generative AI Tools: I apply Generative AI tools and Prompt Engineering to create text, images, and multimodal outputs, while implementing Safety Filters and output quality controls. 12. Streamlit for Prototyping and Demos: I build interactive web apps with Streamlit to Showcase models, create user-friendly demos, and let stakeholders explore model outputs live. 13. Power BI for Reporting and Dashboards: I combine model results with business data in Power BI to create interactive Dashboards and Reports that help stakeholders explore insights and make data-driven decisions. Verification Link: Muhammad Umar Certification - Analytix Camp
Testimonial
Muhammad Abbas
Chief Executive OfficerData Science Project Development
via Fiverr - May, 2025 - Nov, 2025I am delighted to commend Muhammad Umar for his exceptional dedication, remarkable achievements, and unwavering commitment to excellence. He consistently demonstrates a strong work ethic, a keen enthusiasm for learning, and a proactive approach to challenges, making a significant positive impact on our academic environment. Muhammad Umar not only excels academically but also fosters a collaborative and supportive spirit among his peers. His ability to combine diligence, curiosity, and teamwork sets him apart as a role model, and his accomplishments serve as an inspiration to others. There is no doubt that Muhammad Umar possesses the potential to achieve continued success and make meaningful contributions in all his future endeavors.
Contact With Me